Go from data to insights with Power BI – a fully integrated business intelligence tool for your Synergetic software. Our extensive range of visual, interactive dashboards gives you vital information at a glance.
Interactive dashboards for data visualisation
12 interactive dashboards are available now. We work closely with our users to develop the most relevant and useful dashboards and reports. In fact, you’ll see two new dashboards released every month.
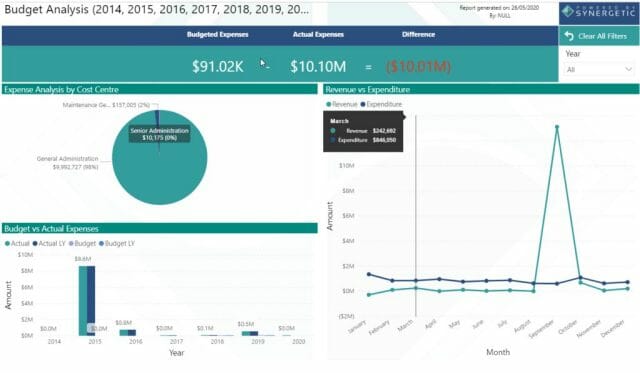
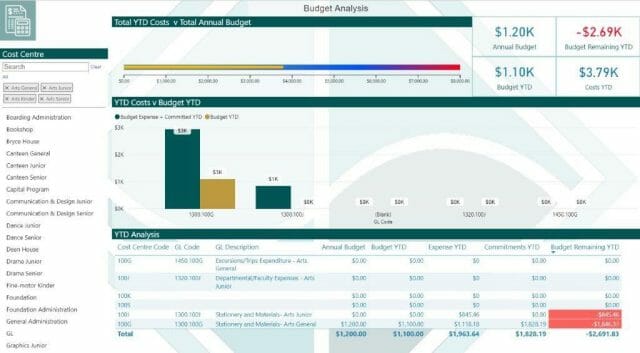
Budget analysis – New (v69.50 required)
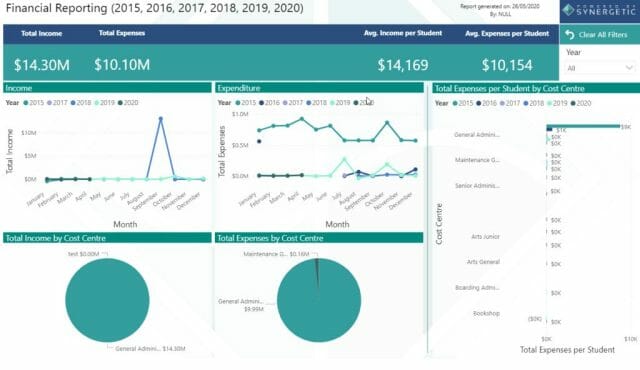
Finance – New (v69.50 required)
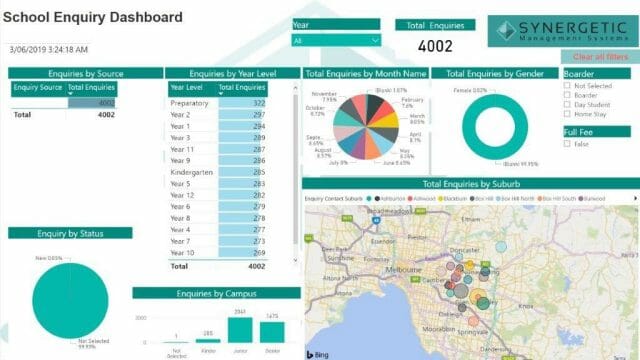
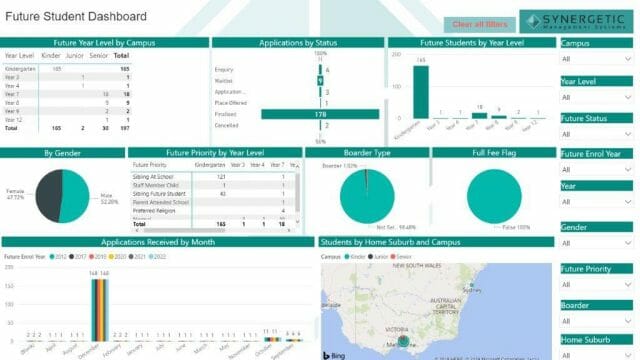
Prospective student demographics
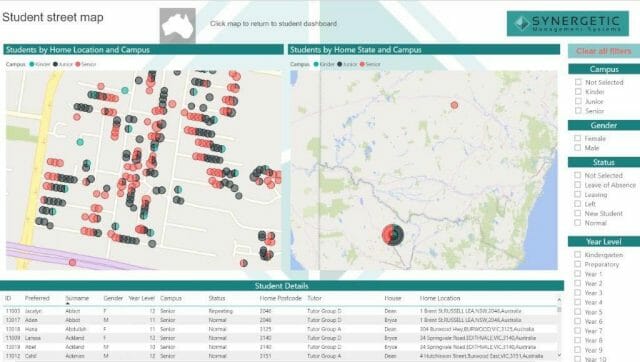
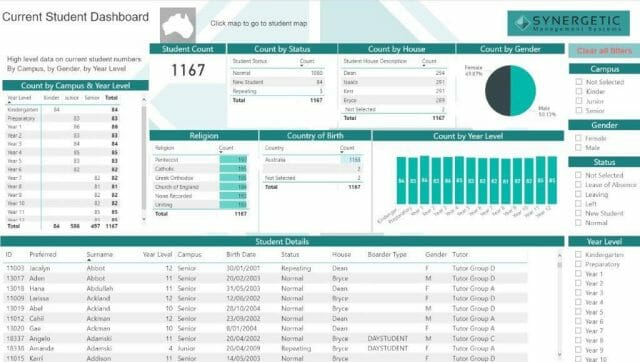
Student information
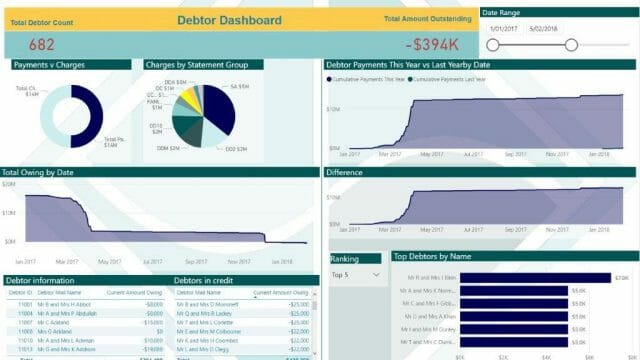
Debtor management
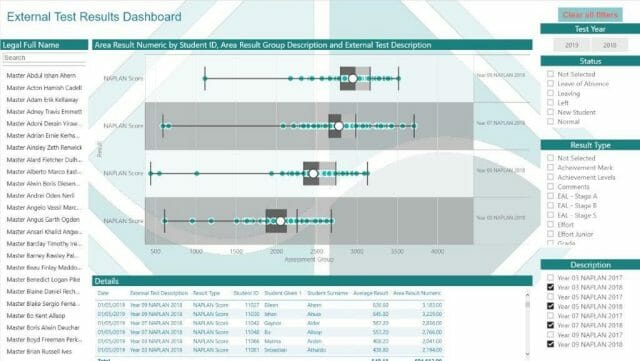
External testing results
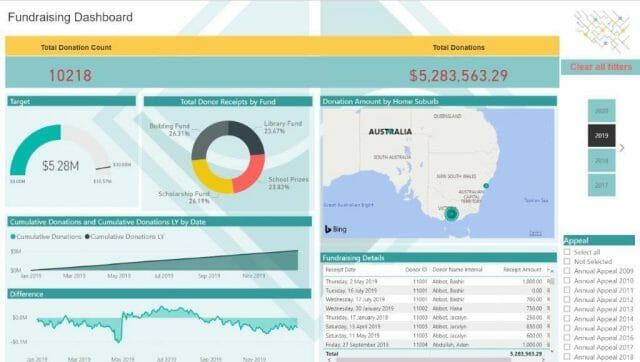
Fundraising campaigns
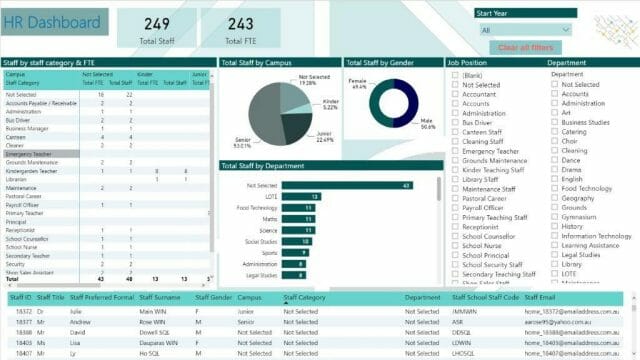
Human Resources
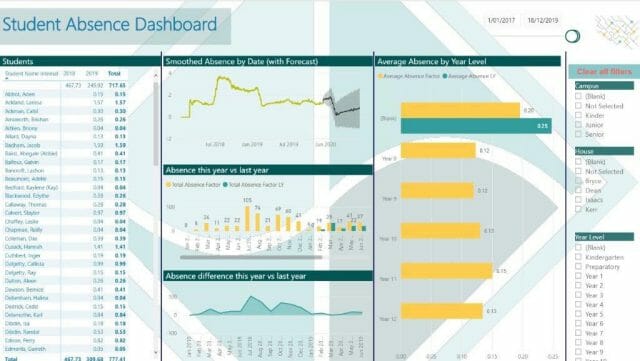
Student pastoral care
Coming soon – Student assessment
Coming soon – Class assessment
Have an idea for a new dashboard? Add your dashboard suggestion or feedback to discourse.
Create a ‘data culture’ in your school
Synergetic Dashboards by Microsoft Power BI enables you to visualise and share your data. Dashboards are live and interactive to give you the information you need, whenever you need it.
- Allow your data to inform your decisions. Power BI connects to your Synergetic system and allows you to interact with the reports, filtering and drilling down on the report in real time, looking for trends, gaining insights and seeing your data in new ways.
- Your reports can be securely accessed, and all data is safeguarded to meet the stringent industry compliance standards and certifications.
Subscription Inclusions
Access to powerful and interactive dashboards across different streams to make informed decisions.
System set up to synchronise your data.
Ongoing support for existing dashboards and reports.
Continual improvements – with new dashboards released on a regular basis.
Want to find out more?
Contact our expert team of software consultants to book a live interactive demonstration to see what Power BI can do.